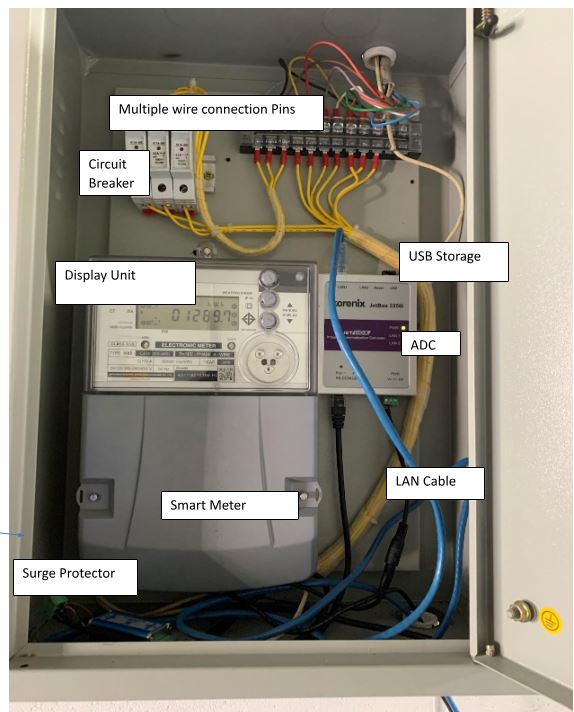
The main objective of installing Smart Meter in the academic building is to monitor the building energy consumption and for identifying possible ways to reduce energy consumption.
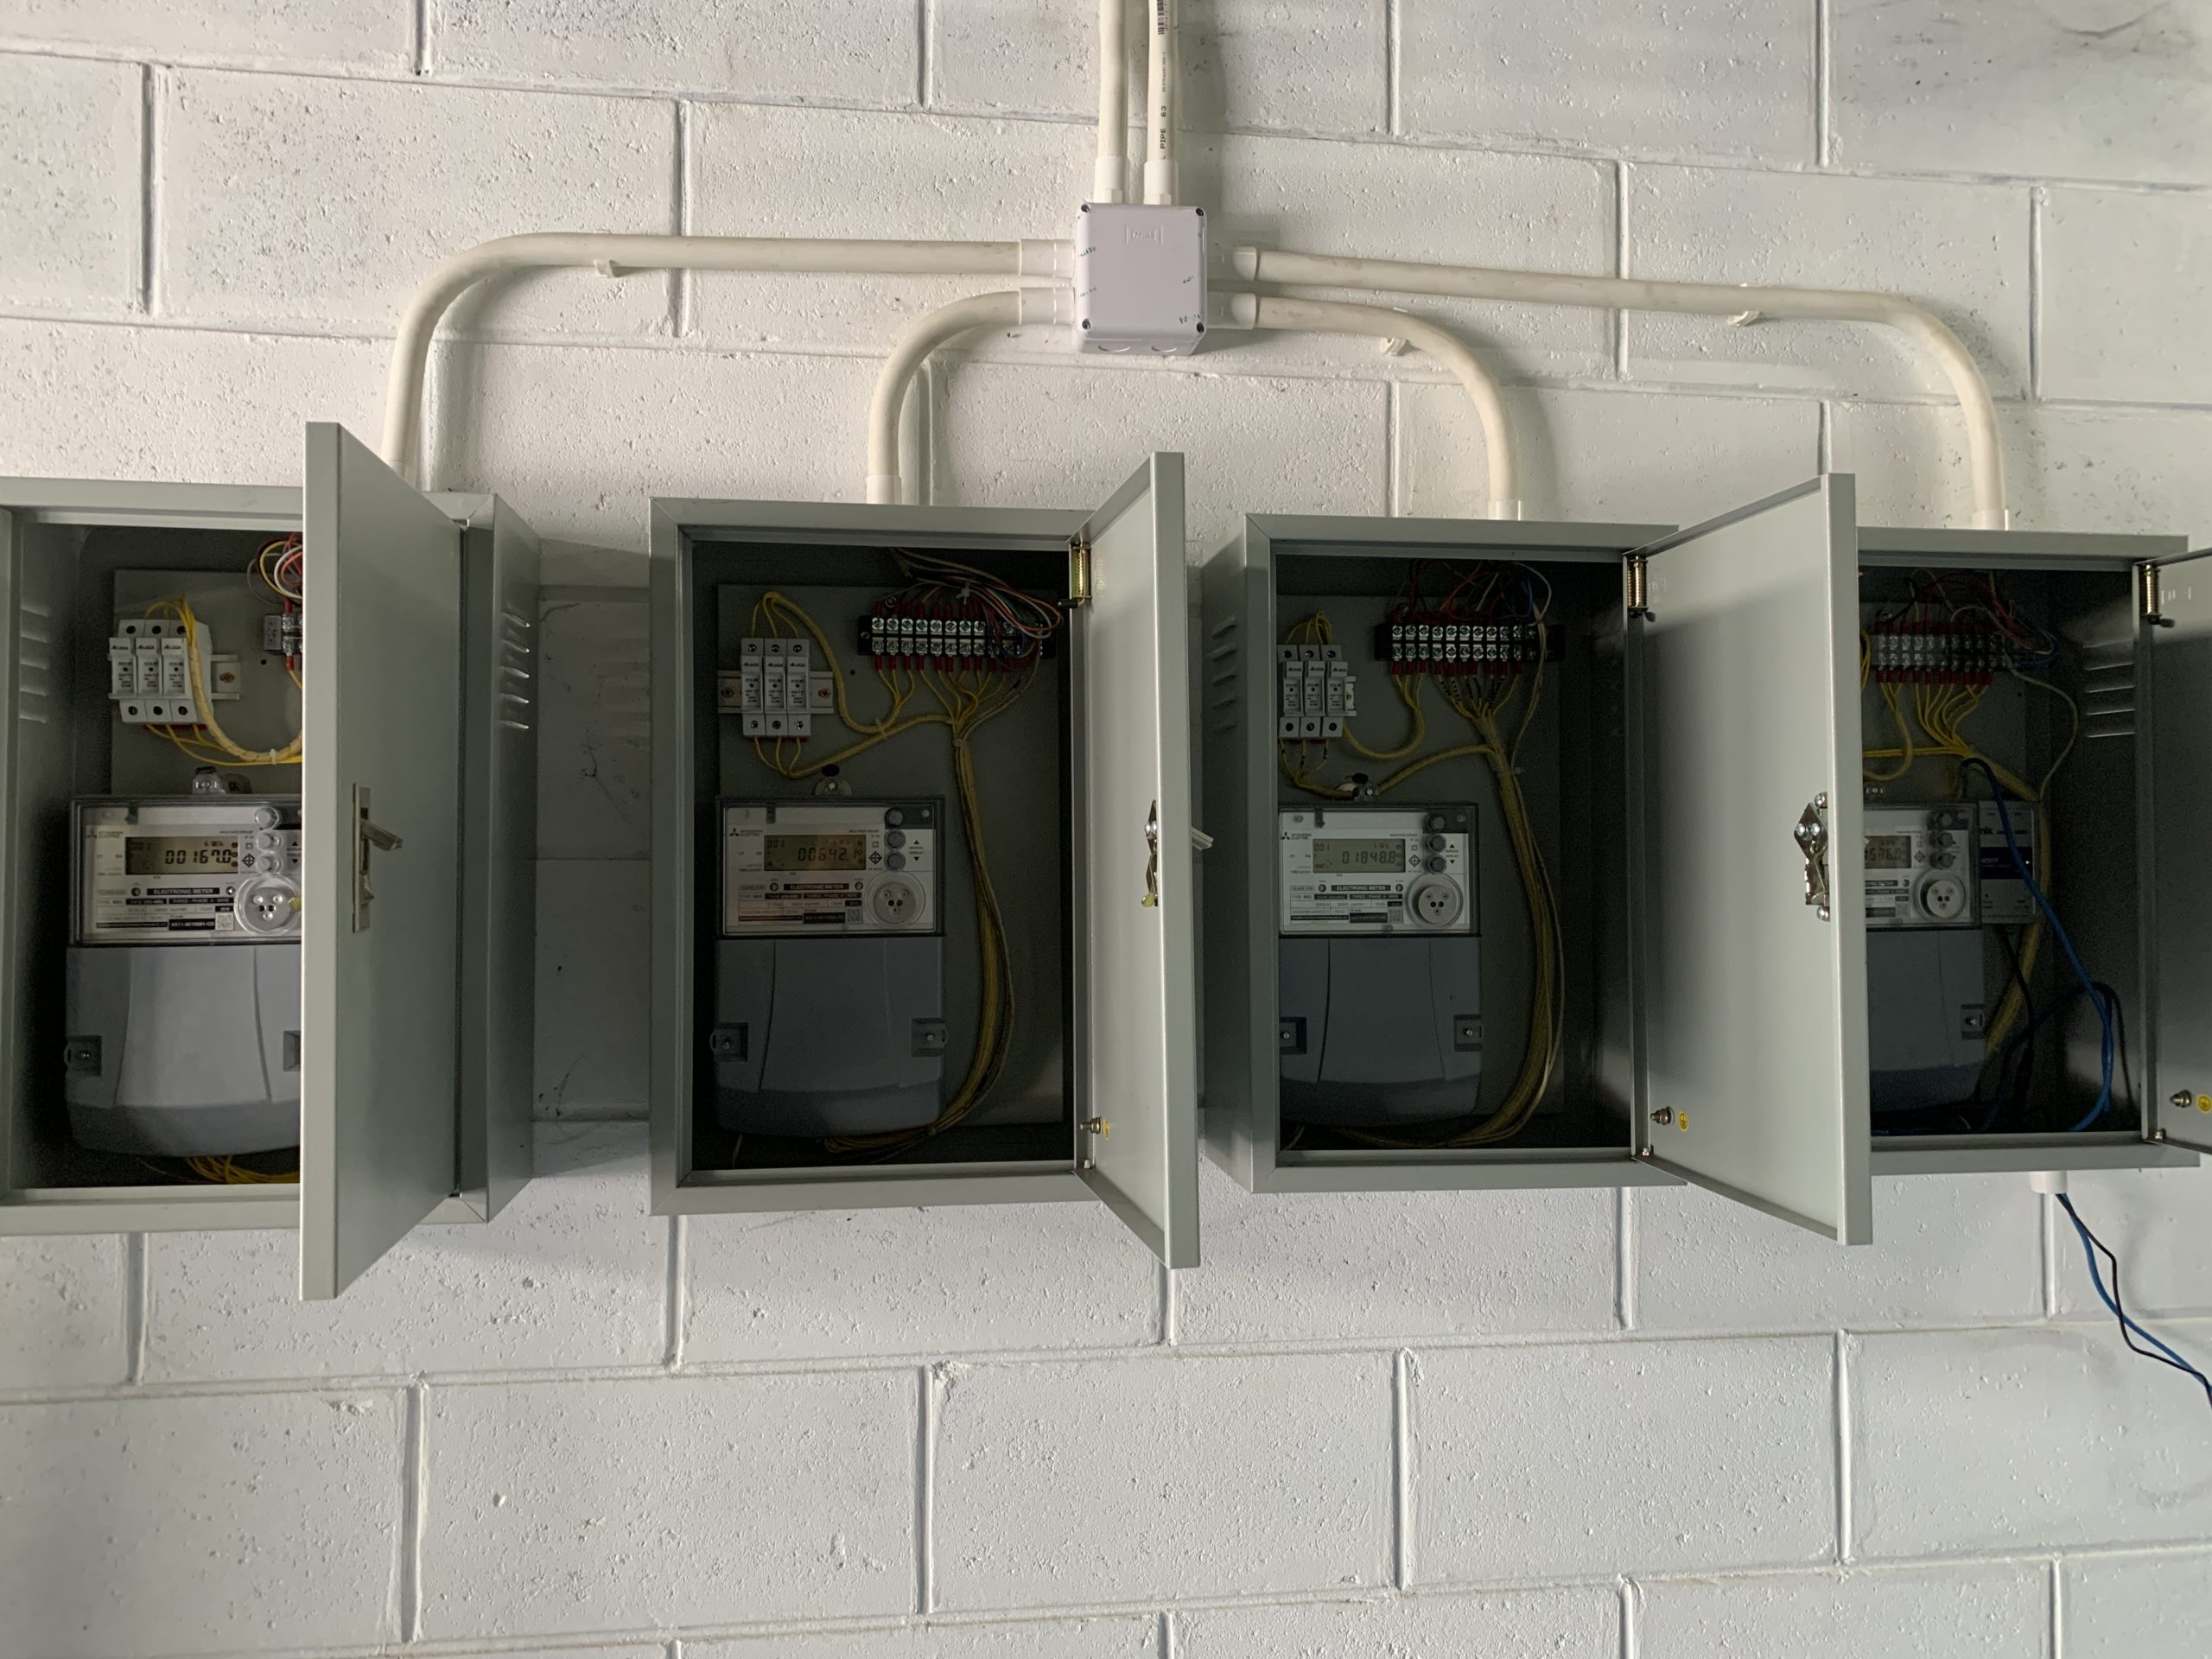
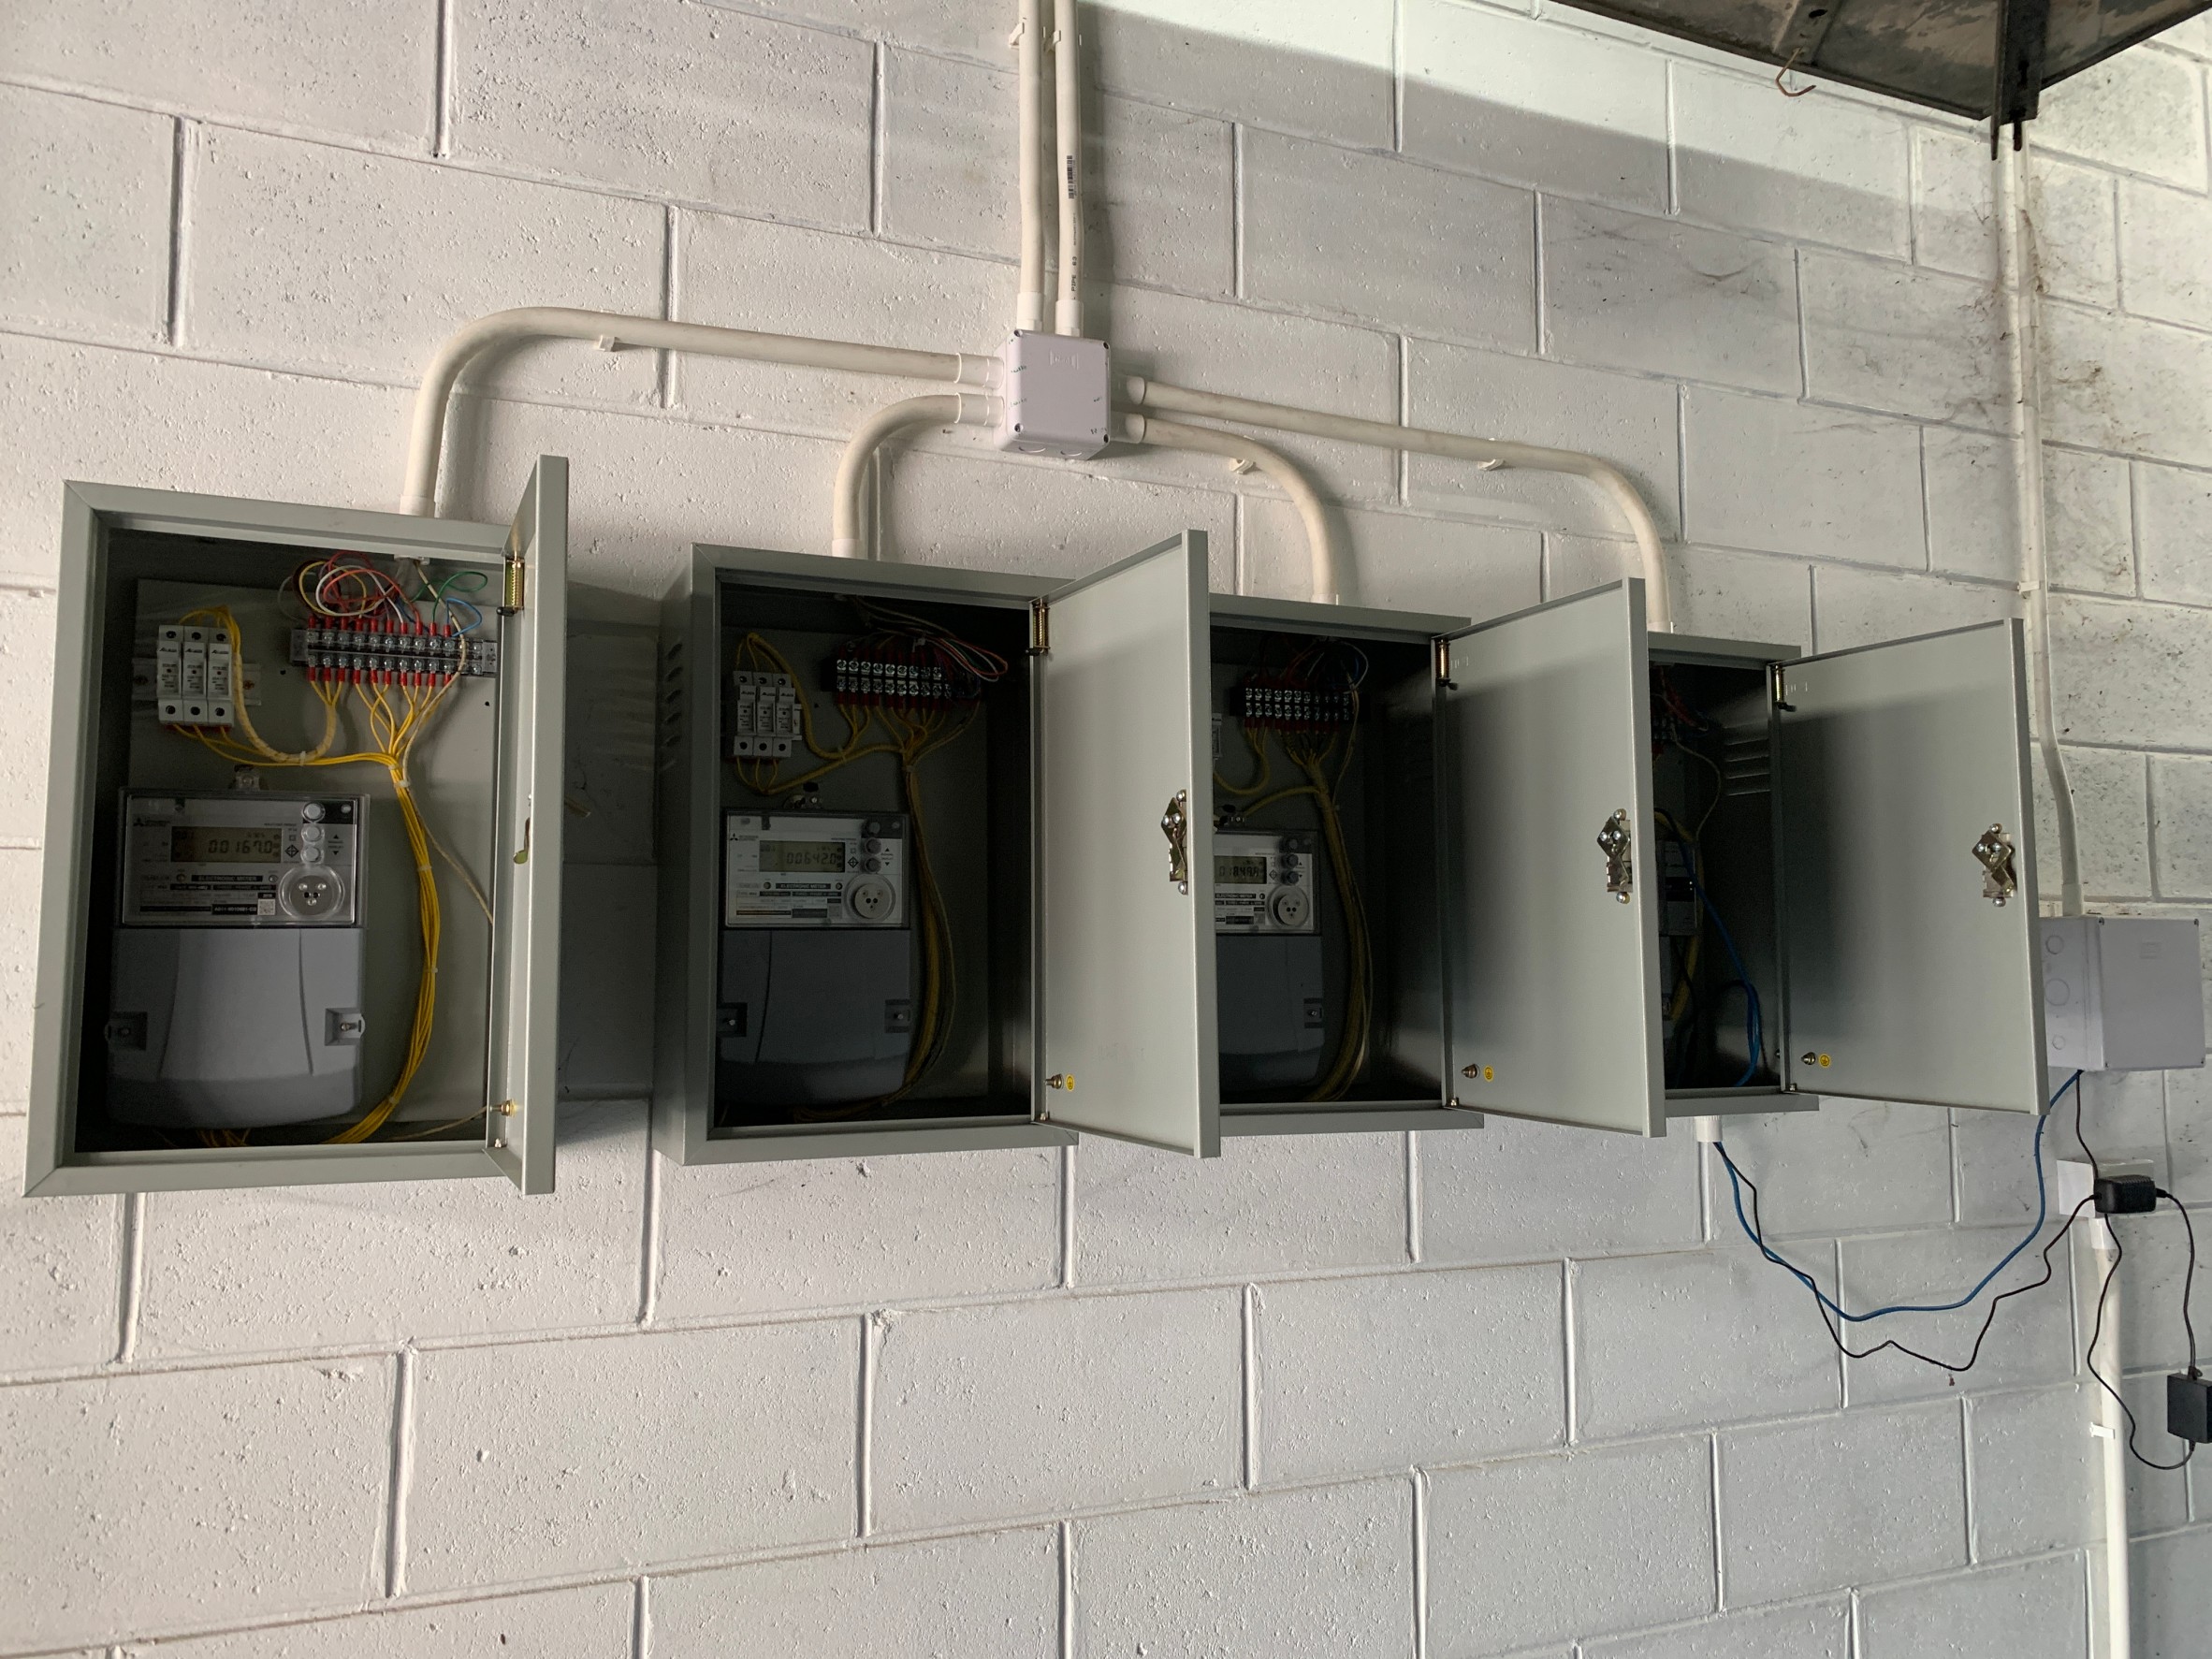
Though the project was initiated in October 2019, due to COVID-19 Pandemic the installation process could only be started in August 2020 and has been under operational testing in Oct 2020. The energy consumption recording officially started on 17 October 2020. A total of 26 smart meters were installed in the academic buildings.
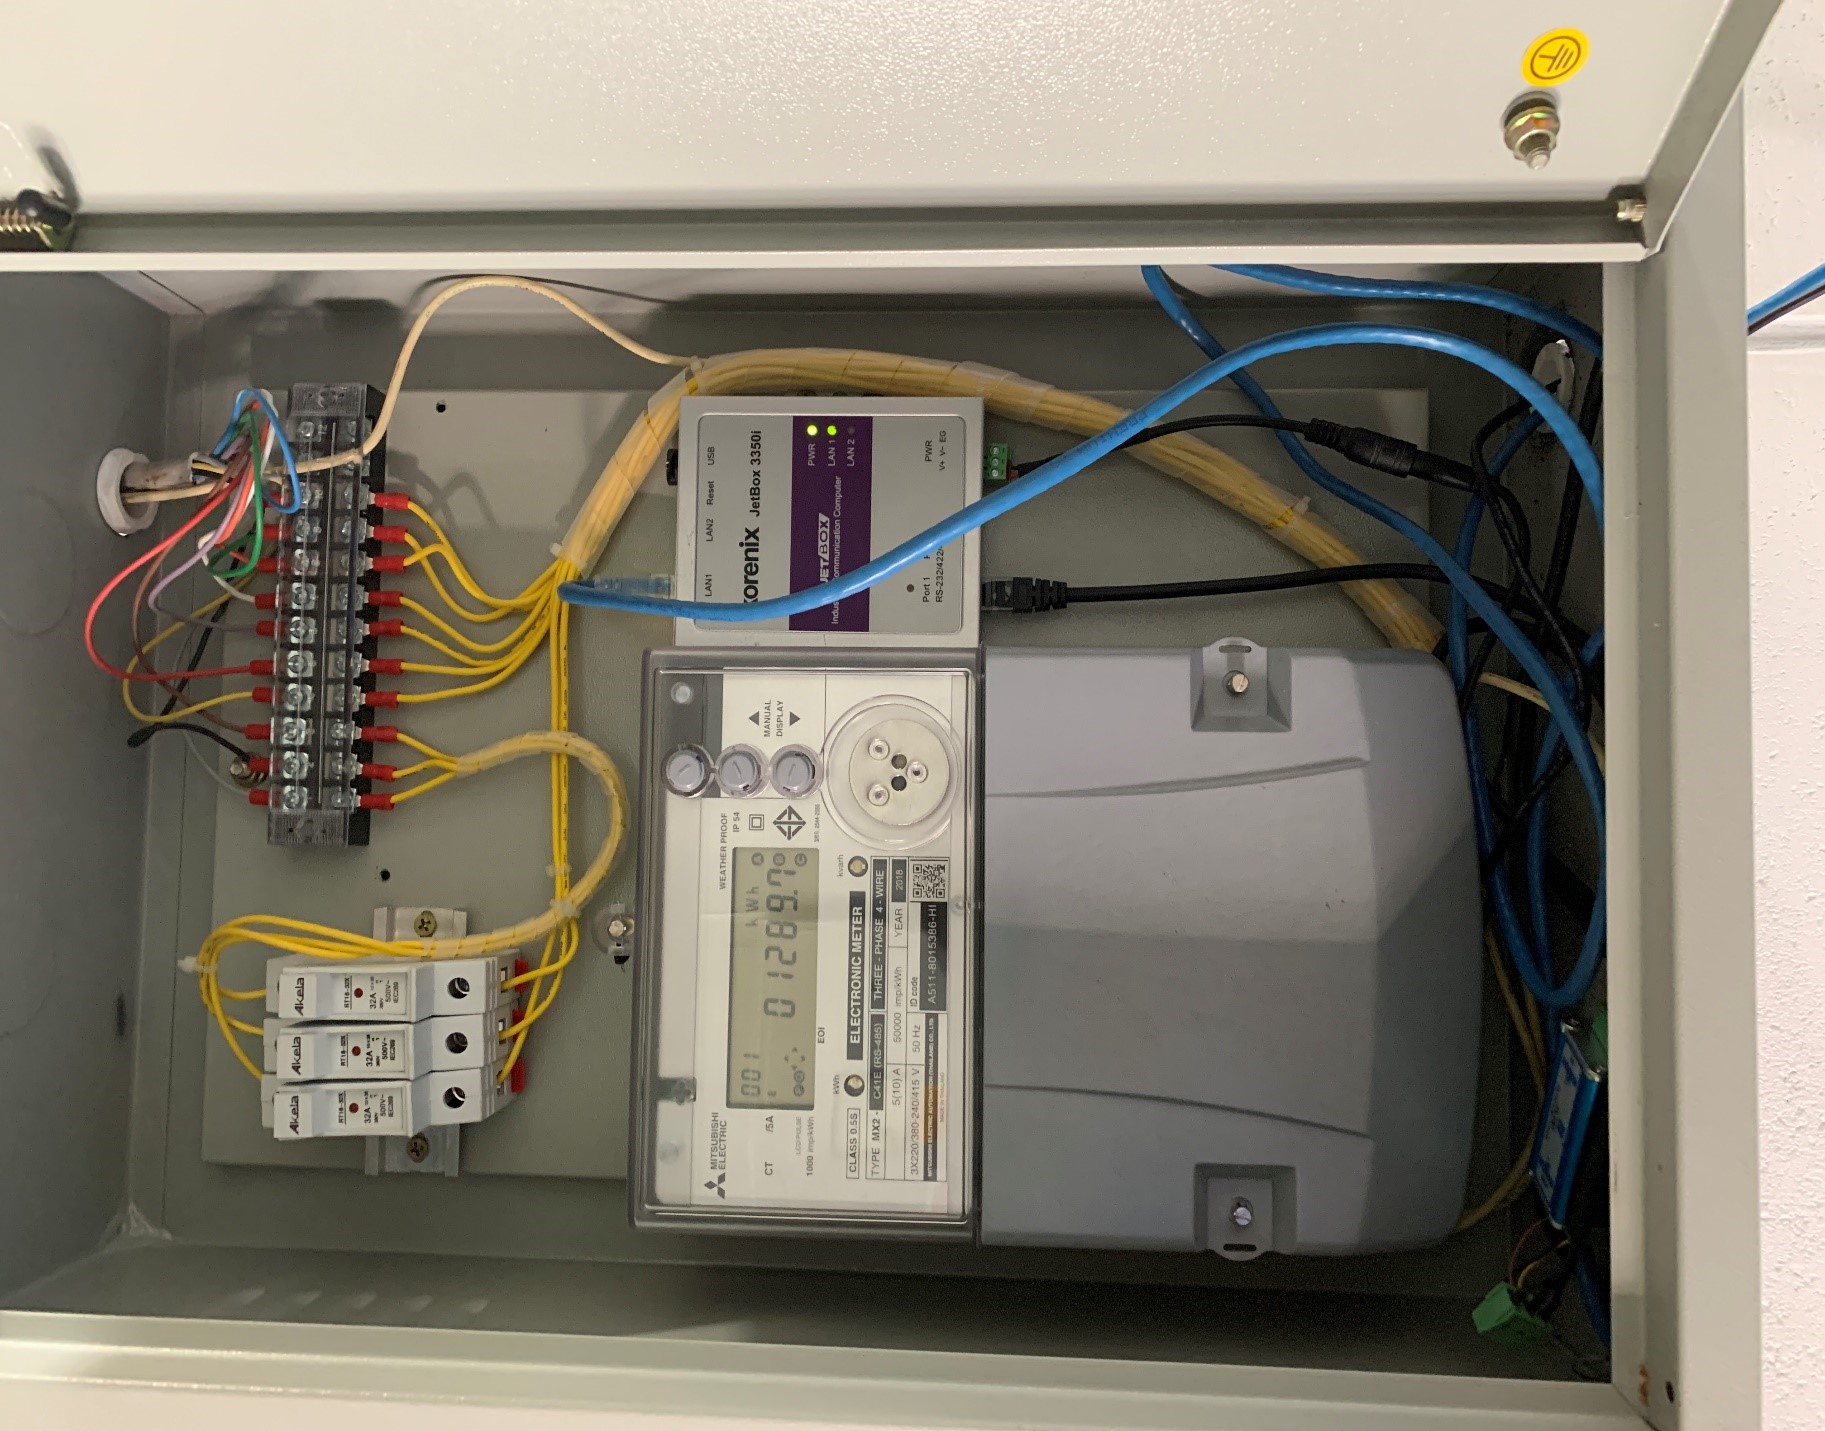
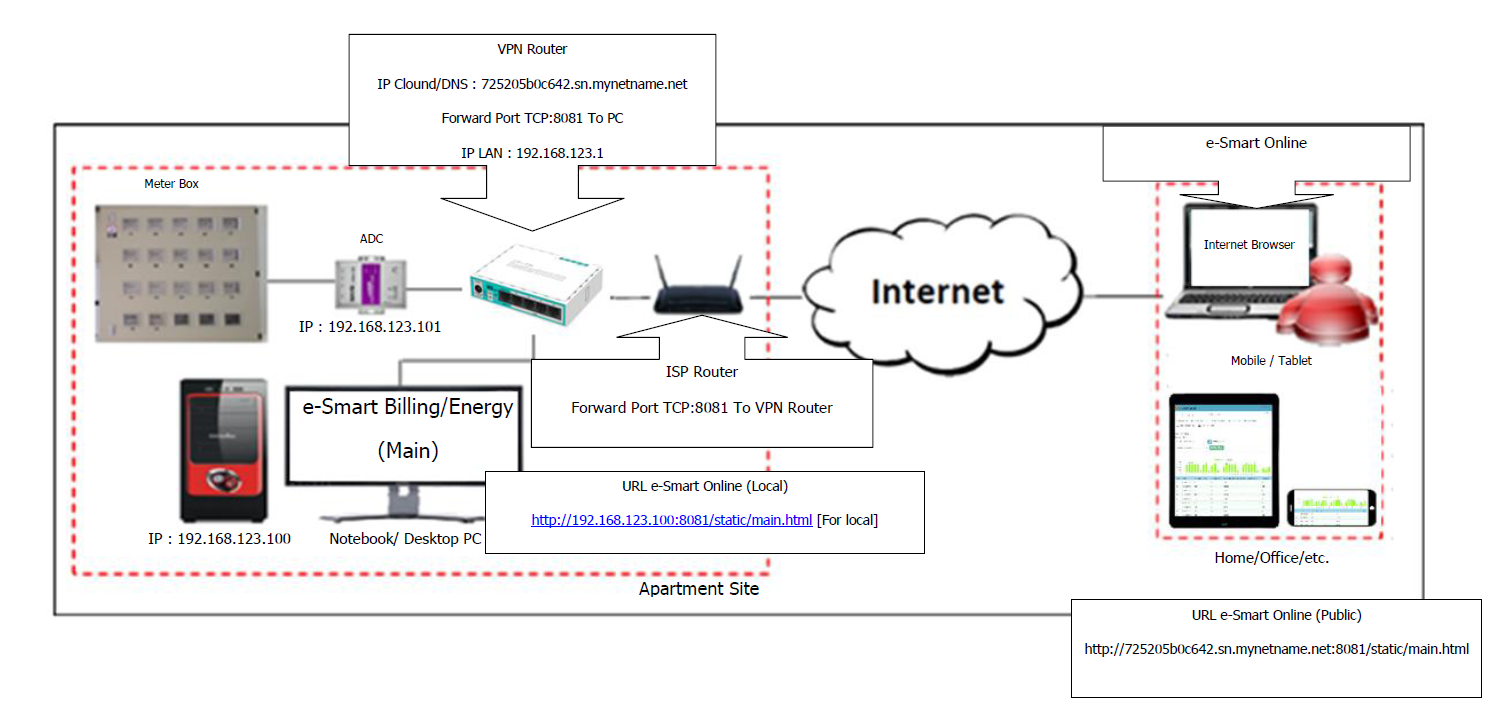
The smart meter records the energy consumption data in intervals of every 15 min. So the data can be retrieved from the E-smart energy software which is remotely connected to the ADC” s, on an hourly, daily, monthly, or yearly basis. Through the recorded data AIT target monitoring the consumptions of each school and other buildings to identify the areas where and how the consumption could be reduced. AIT is also working on installing the Solar PV system in near future, where most of these buildings’ energy needs could be supplied from renewable energy resources and a smart meter would help to monitor actual consumption data from Provincial Electricity Authority (PEA) and Solar PV system.
School/Unit | Nov 2020 kWh | Dec 2020 kWh | Jan 2021 kWh | Feb 2021 kWh | Mar 2021 kWh | Apr 2021 kWh | May 2021 kWh | Jun 2021 kWh | Jul 2021 kWh | Aug 2021 kWh | Sep 2021 kWh | Oct 2021 kWh | Nov 2021 kWh | Dec 2021 kWh | Jan 2022 kWh |
SERD | 123,144 | 113,886 | 106,574 | 115,033 | 134,096 | 117,487 | 112,059 | 111,777 | 110,484 | 107,005 | 111,145 | 119,625 | 121,956 | 117,501 | 134,220 |
SET | 30,892 | 28,185 | 27,165 | 28,469 | 33,592 | 30,507 | 26,379 | 28,717 | 28,342 | 26,417 | 26,918 | 28,369 | 27,535 | 25,251 | 26,529 |
SOM | 2,628 | 2,164 | 1,952 | 2,932 | 3,056 | 1,944 | 1,912 | 1,836 | 1,776 | 1,476 | 1,560 | 1,424 | 1,572 | 1,392 | 1,456 |
Admin & service units | 52,232 | 47,572 | 42,132 | 45,732 | 56,928 | 52,728 | 47,288 | 45,184 | 42,144 | 35,076 | 35,228 | 37,968 | 37,604 | 39,636 | 42,972 |
Chiller | 244,968 | 289,485 | 202,646 | 252,023 | 342,303 | 304,389 | 309,409 | 308,581 | 286,677 | 262,634 | 251,338 | 261,066 | 247,108 | 217,390 | 231,096 |
Centers | 21,404 | 21,772 | 18,952 | 22,492 | 23,550 | 21,195 | 21,639 | 22,102 | 22,094 | 22,614 | 22,245 | 22,646 | 22,604 | 21,738 | 23,370 |
AITCC + Arcade | 34,816 | 35,352 | 28,632 | 29,152 | 36,416 | 33,336 | 32,464 | 32,776 | 30,920 | 29,224 | 27,792 | 30,904 | 33,248 | 35,624 | 35,040 |
Residential area | 105,752 | 105,115 | 95,431 | 97,654 | 112,172 | 155,802 | 145,516 | 192,262 | 153,141 | 165,108 | 130,592 | 126,596 | 118,750 | 87,625 | 83,719 |
Street lights/pumps/others | 101,404 | 184,469 | 103,996 | 153,993 | 240,927 | 139,172 | 181,494 | 106,365 | 113,902 | 104,046 | 121,102 | 134,722 | 121,263 | 100,163 | 136,438 |
School/Unit | Average kWh% 2020 | Average kWh% 2021 | Variation |
SERD | 15.46% | 14.97% | -0.49% |
SET | 3.86% | 3.64% | -0.22% |
SOM | 0.31% | 0.24% | -0.07% |
Admin & service units | 6.51% | 5.55% | -0.97% |
Chiller | 34.56% | 34.60% | 0.04% |
Centers | 2.81% | 2.85% | 0.05% |
AITCC + Arcade | 4.56% | 4.11% | -0.45% |
Residential area | 13.72% | 16.89% | 3.17% |
Street lights/pumps/others | 18.21% | 17.14% | -1.07% |