AIT Water Consumption
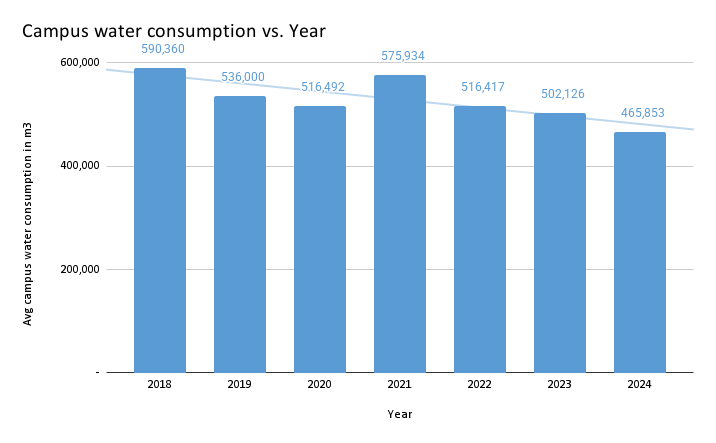
The Provincial Water Authority (PWA) is responsible for providing Water to the entire campus. Despite the challenges posed by the COVID-19 pandemic, the campus has managed to achieve a 12.5% decrease in water consumption compared to the pre-COVID year of 2018 and the post-COVID year of 2022, thanks to the implementation of various water conservation measures, like revamping the major water supply system and replace place many main water valves from 2017 to 2022. For more details on projects click hereĀ .
Annual Water usage on Campus
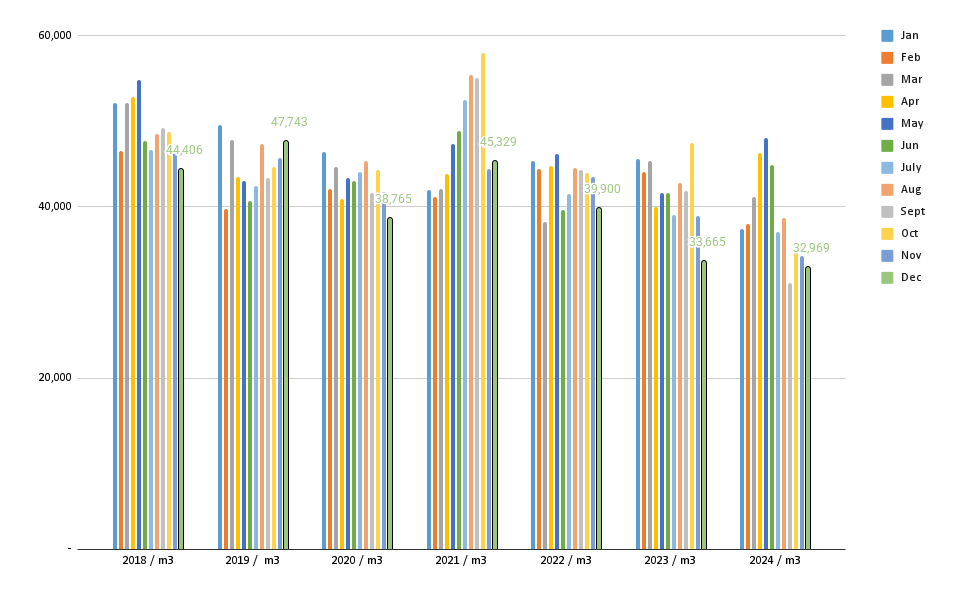
Monthly Water Usage on Campus
| Year/ unit | Jan | Feb | Mar | Apr | May | Jun | July | Aug | Sept | Oct | Nov | Dec | Annual |
| 2018 / m3 | 52,180 | 46,531 | 52,199 | 52,825 | 54,836 | 47,655 | 46,672 | 48,553 | 49,235 | 48,746 | 46,522 | 44,406 | 590,360 |
| 2019 / m3 | 49,597 | 39,814 | 47,866 | 43,506 | 43,044 | 40,727 | 42,463 | 47,366 | 43,414 | 44,680 | 45,780 | 47,743 | 536,000 |
| 2020 / m3 | 46,414 | 42,096 | 44,695 | 40,901 | 43,372 | 43,011 | 44,105 | 45,406 | 41,595 | 44,337 | 41,795 | 38,765 | 516,492 |
| 2021 / m3 | 41,935 | 41,159 | 42,094 | 43,822 | 47,349 | 48,825 | 52,500 | 55,386 | 55,079 | 57,982 | 44,474 | 45,329 | 575,934 |
| 2022 / m3 | 45,329 | 44,417 | 38,295 | 44,805 | 46,201 | 39,595 | 41,542 | 44,567 | 44,315 | 43,956 | 43,495 | 39,900 | 516,417 |
| 2023 / m3 | 45,606 | 44,141 | 45,367 | 39,977 | 41,614 | 41,614 | 39,077 | 42,743 | 41,859 | 47,526 | 38,937 | 33,665 | 502,126 |
| 2024 / m3 | 37,384 | 37,951 | 41,178 | 46,309 | 48,039 | 44,951 | 37,097 | 38,657 | 31,125 | 35,877 | 34,316 | 32,969 | 465,853 |
For more details on water conservation and care please refer to link here Water Conscious usage and Care